Understanding Strings in Java
Hello Friends, Welcome to my blog. A Blog which shares the deep secrets inside the java and presents it in front of you so you can understand the concept easily and can accommodate it in your professional life.
Introduction
Today's topic is the strings in java. Strings are the immutable objects in java. Once it is created it cannot be changed. if one needs to change the string, java creates new strings for you. At the core, java manages a pool of Strings. Whenever anyone requests to store the string, java first checks the existence of that string in the pool, if it is there simply it returns the reference object of that string to the caller.
One might ask why is so! Java is using the concept of "String interning". It is a method of storing only one copy of each distinct string. this will allow the runtime to save memory. String interning is an example of "Flyweight pattern" software design pattern.
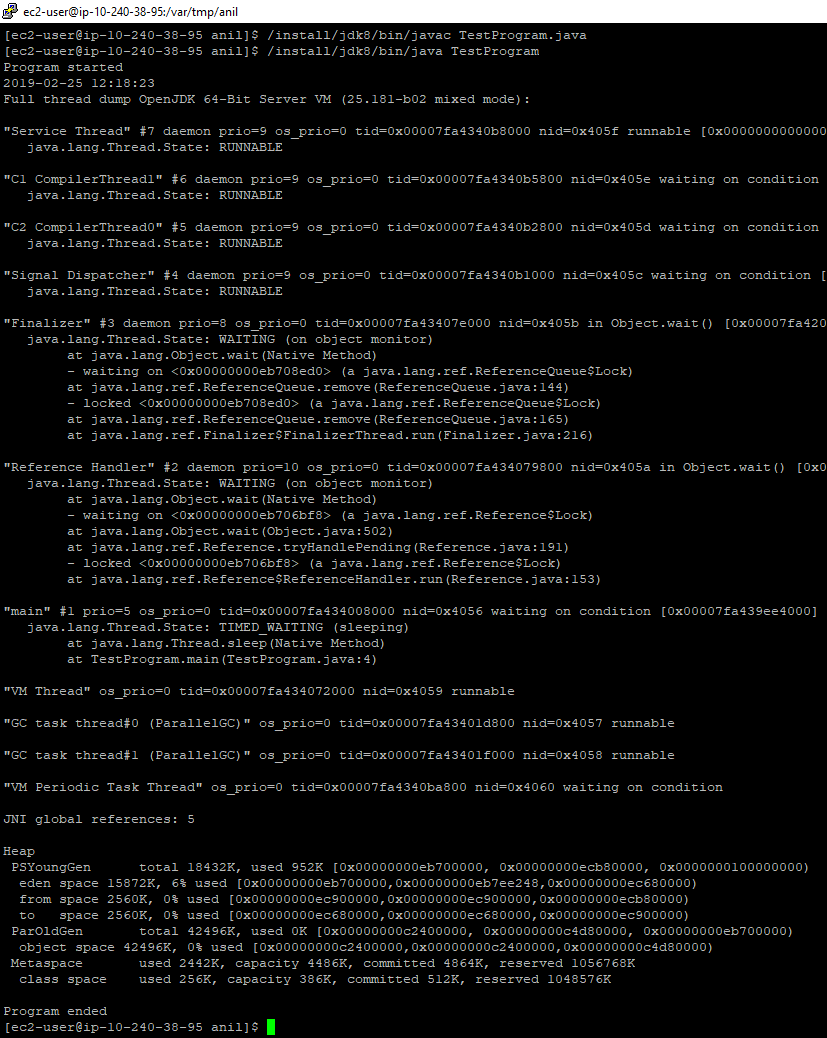
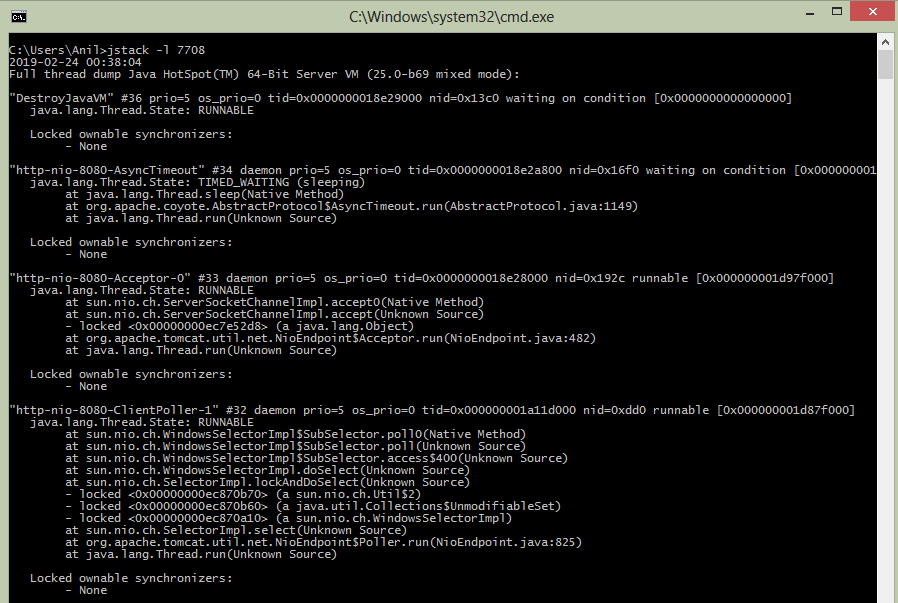
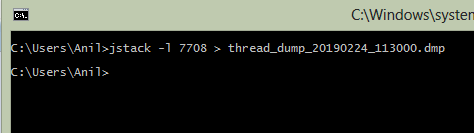
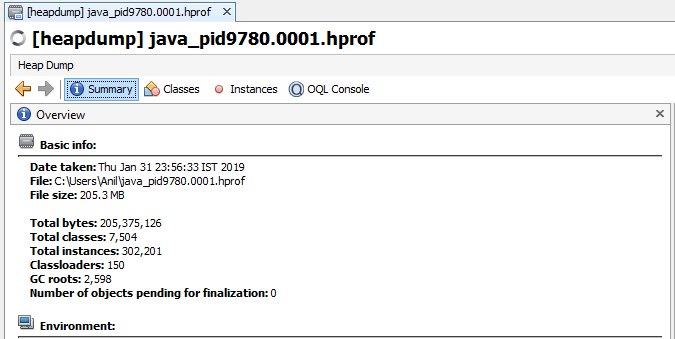
I hope you are a clear idea now about the strings in java so let's get our hand dirty with programming and take our application to the operation theater and scissors it with the heap dump. If you are a newbie to the heap dump refer my blog here. I have added a breakpoint at the last sentence and in this way I have captured the heap dump of my application.
Let's take below example.

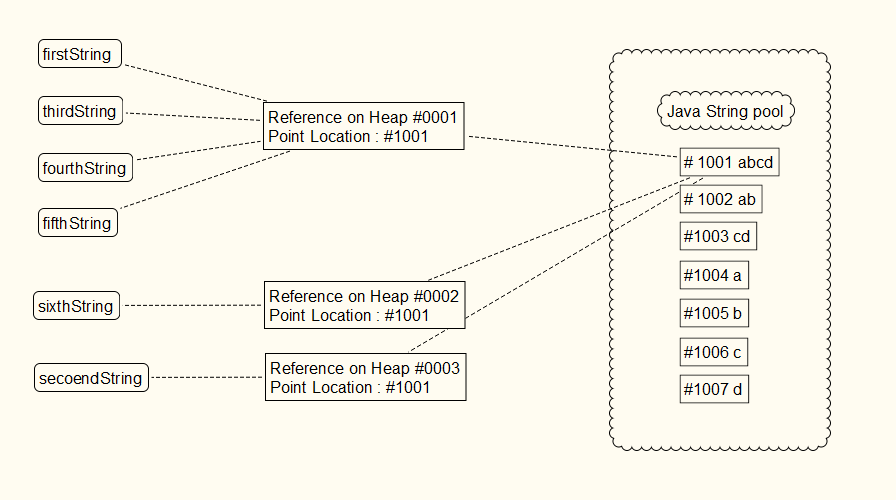
In the above application, We have created 6 strings each of them store the "abcd" value in different ways. some store directly, while others are doing the concatenation. But as the string interning method, only one instance of "abcd" is stored. Let's discuss each step in detail
Above steps can be understood by below screenshot
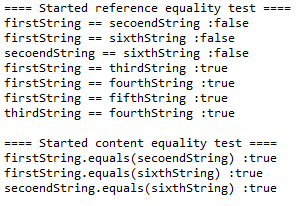 I Hope you have a clear understanding of the comparison operator and the equals method. if not here is the few words can help you. comparison operator "==" when used on the objects (not on primitive) it compares the reference variable; do they are same or not. here firstString, thirdString and fourthString are having same reference variable. but the firstString, secoendString, and sixth string are having different reference variable (although they point to the same value, the variable will refer to different pointers stored on a different location) . as opposite the equals method will compare the actual content present in the variable.
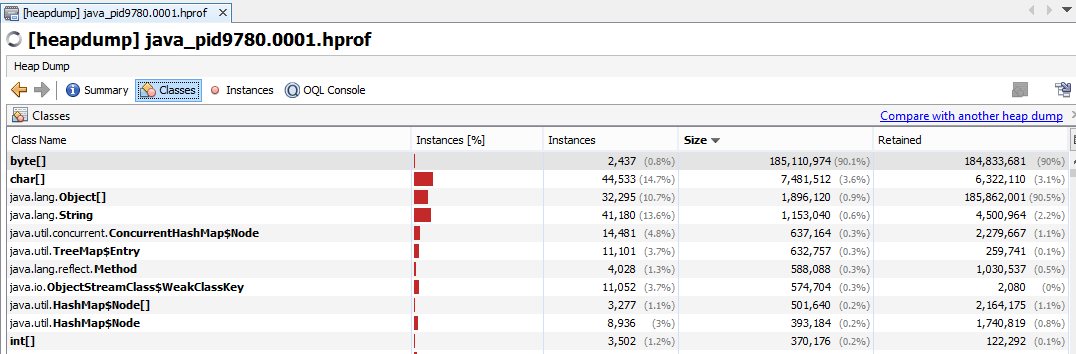
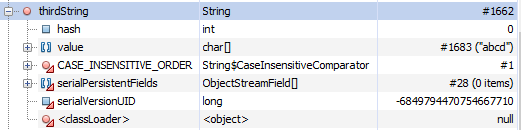
Below are the few footprints when we open the heap dump of the application. if you see below image, you will come to know that first, third, fourth and fifth variables are having same reference #1662. however, the second variable is having reference #1663 and the sixth variable is having reference #1664. but in the end, all of them are having a value "abcd" which is located on location #1683.
Refer below screenshot for heap dump instance view.

Each of the variable after expanding their properties


So that's all friend hope you have understood the immutable nature of the string and how java store the string. if you have any question please comment below. your feedback is also valuable to improve my future blogs. do share it!
Happy Coding & Have a wonderful day.
-Anil Sable
I hope you are a clear idea now about the strings in java so let's get our hand dirty with programming and take our application to the operation theater and scissors it with the heap dump. If you are a newbie to the heap dump refer my blog here. I have added a breakpoint at the last sentence and in this way I have captured the heap dump of my application.
Let's take below example.
In the above application, We have created 6 strings each of them store the "abcd" value in different ways. some store directly, while others are doing the concatenation. But as the string interning method, only one instance of "abcd" is stored. Let's discuss each step in detail
- on the line #9 first string is initialized with string "abcd, As of now string pool doesn't consist this string so java initially put this string in the pool & return the reference to the user.
- on the line #11 third string is initialized with the concatenation of "ab" and "cd". Here java stores the "ab" and "cd" string in the string pool, concat them and found that result already exist in the pool. so instade of creating new string, it return the referece to it. so now the first variable and third variable are pointing to the same value with the same reference variable.
- on the line #12 same is happened, all the 4 string stored in the string pool. java does concatenation on them and found that the result is already there in the pool. it returns the reference to the value.
- on line #13 same is happened as above. till now first, third, fourth and fifth variables are pointing to the same value with the same reference variable.
- on line #10 and #14, we have used a new operator. but still, the principle will not change for the string interning. here the second and sixth variable will point to the same value but having distinct reference variable.
Above steps can be understood by below screenshot
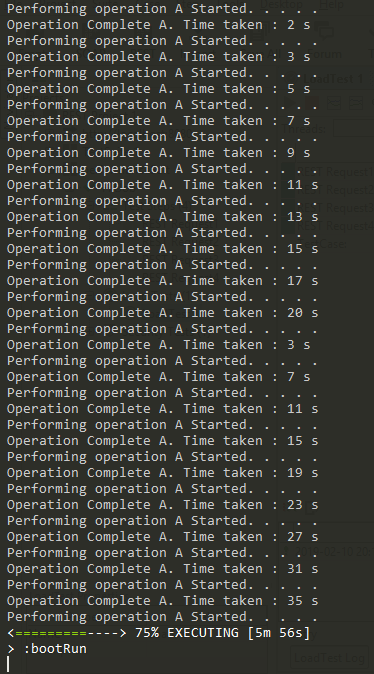
Here is the output of the program
Below are the few footprints when we open the heap dump of the application. if you see below image, you will come to know that first, third, fourth and fifth variables are having same reference #1662. however, the second variable is having reference #1663 and the sixth variable is having reference #1664. but in the end, all of them are having a value "abcd" which is located on location #1683.
Refer below screenshot for heap dump instance view.
Each of the variable after expanding their properties
So that's all friend hope you have understood the immutable nature of the string and how java store the string. if you have any question please comment below. your feedback is also valuable to improve my future blogs. do share it!
Happy Coding & Have a wonderful day.
-Anil Sable