How to take java thread dump on windows, Linux & Other Operating System
Hello Friends, Today in this blog we will be learning how to take a thread dump on Windows and Linux Operating System. We can take a Thread dump of a local running process or remotely running process. If you already have a thread dump and just looking for the information to analyze then you can refer my blog here.
Let's get started then.
Capturing Thread dump of Local Running Process on Linux Operating System
We will be using kill command here, This is the most popular command in Linux to send a different kind of signals to the process. this command is only available on Linux and not on windows. We have to send the SIGQUIT signal and the process id with this command. To learn different Linux kill command signals check out here. refer below steps.
1. Identify the process id of the java application for which we want to take a thread dump. You can use the ps command to list all process & grep the java keyword.
Command: $ ps -ef | grep "java"
Example:
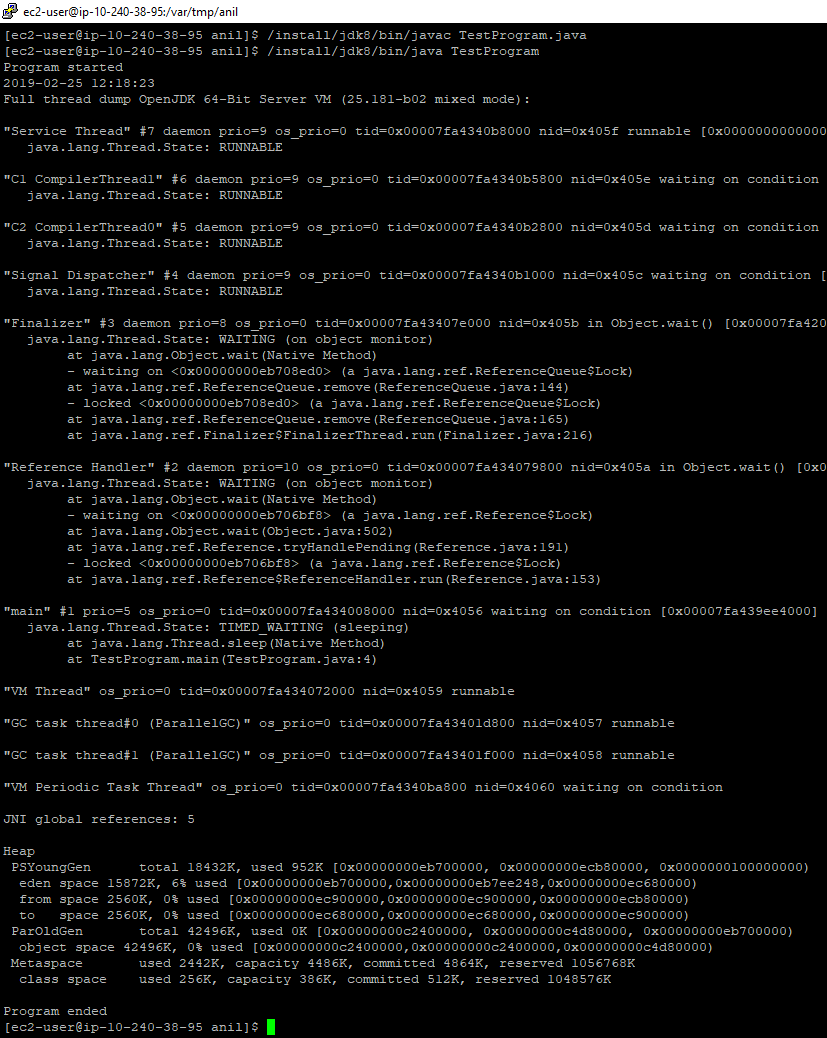
2. use the "Kill -3" command followed by process id which will take a thread dump of the process and put it to STDOUT of the application. Here -3 is equivalent to send SIGQUIT signal to the process.
Command: $ kill -3 <PID>
Example:
Capturing Thread dump of Local Running Process on Windows or Other Operating System
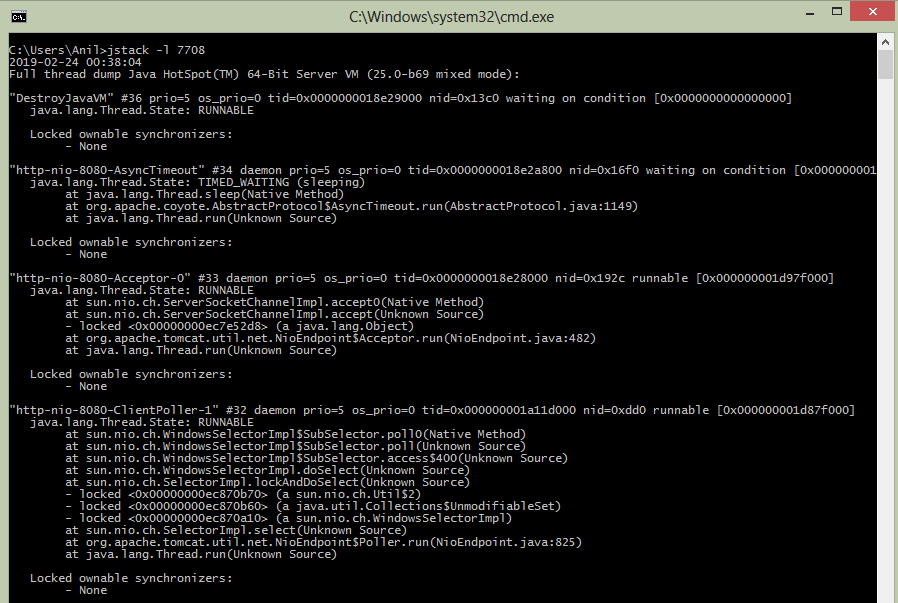
We will be using jstack & jps command here. this command ships with your JDK installation bundle and present in the bin directory of the JDK. You can use this command on Linux as well as Windows & Other Operating system. before running these commands ensure JDK bin directory is added to the PATH environment variable. below are the steps
1. Identify the java process id for which you want to take a thread dump. for this, you can use jps command. Executing this command will list the all running java application. You need process id from the output list.
3. You can redirect output to separate text file which will be easy to maintain & process by thread dump analyzer tools.
Capturing a thread dump of remotely running java process
In this technique, we don't have to ssh or log in to the remote system. We have to enable the JMX Monitoring on our java application before running. When we enable this functionality, java application opens a port over which many things can be carried out. like statics of the application, thread dump, heap dump. You can read more about this here
Using GUI Tools for Thread dump and other monitoring tasks
JDK provides 2 GUI tools for application monitoring. both ship with JDK bundle & present in the bin directory of the JDK. "JConsole" is one tool from you can see the live thread stack trace. you can use this tool on Linux as well as on Windows for the locally running or remotely running java process. Below are the few features provided by this tool
- View Memory Status
- View MBeans
- View Stack trace of a thread
- VM Status
For remotely running process you need to enable JMX Port on the process.
JConsole Tool
- Take Thread Dump
- Take Heap Dump
- Check Heap memory status
- View stack trace of a thread
- Ask JVM to invoke GC
- Check CPU Usage
- Analyze Heap dump
- Sampler
- Profiling
That's all for this tutorial friends. Please let me know your comments, questions or suggestion in below comment box, I will definitely try to improve the content and resolve your queries.


