Thursday, February 21, 2019

Find out latency increase issue while performance test, take java thread dump and analyze it


Hello Friends in this blog we will be learning how to analyze thread saturation. if your application facing latency issue on load/performance test you should read this article.   

Background of the Problem Statement 
In a large complex java application, it happens many times that few operations run well when running in isolation. But the Latency of the calls increases during performance/load test. This might be happening due to the poor design of the multithreaded system. Below are the few signs which might cause slowness/increase latency to your application calls & this may vary depending on the system. am listing out the generic problem which everyone might encounter.
  • Excessive use of synchronization with improper lock objects
  • Connect to an external system, where the external system does not guarantee immediate response
  • Executing expensive SQL Queries / Using non-indexed columns on the OLTP system
  • Configuring the low number of thread pool & request incoming rate is too high, we can say as thread tuning is not well


How Multithreaded system works
Before we understand the problem in depth, let us understand how multi-threaded system work. Let us take an example of apache tomcat web server. each application server has a thread pool. it has a finite number of threads are defined like 50 or 80 or 100. whenever a request comes into the system, a corresponding job is added to the queue. job scheduler/thread manager check for free thread & assign the job to the thread for execution. and in this way, the job gets on to his journey of serving your request. Here below image depict the picture of what we discussed just now

Ultimately now the job for fetching employee details of id 1234, will assign to thread "Thread #1" as it is an ideal state & ready to work. remaining threads are currently working on another task. so they cannot take other tasks they get freed.

Let's get back to our problem statement
So now you have understood, how the multithreaded system works, you can imagine what can happen if all threads are currently working/running state & constantly new jobs are coming into the system. what will happen in this case? All new job will be queued up. as in when thread frees from their existing task, it will pick up a job from the waiting queue. this will impact the execution time of the request. so now the caller will have to wait till the job was in queue + actual job execution time. in this way, latency gets increased. So now we have understood that queuing up jobs will cause latency increase. Thread execution time should be finitely based on what type of system you are designing & what level of TPS you want to archive from your system. let us see some scenario that one should avoid, which cause the long-running operation execution on the thread. 

So now you have aware of what to do and what not. But how will you identify the problem the in the large complex application if you face increasing latency, slowness problem under load or performance test? 

Just to simulate the latency, I have developed the sample spring boot application which we will be used to identify the problem. I have developed this application just to simulate the thread saturation. It is having "thread.sleep()" statement to simulate latency by external calls or heavy database query.


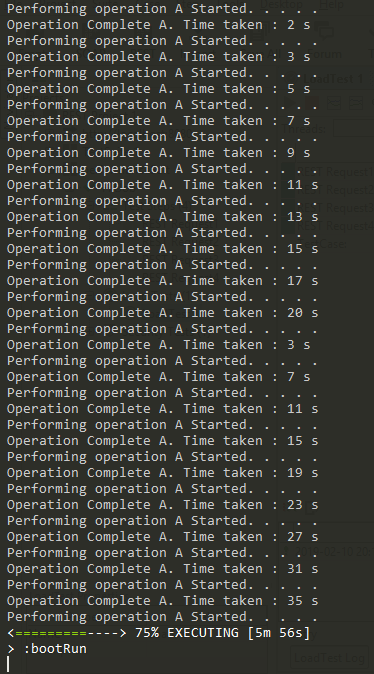
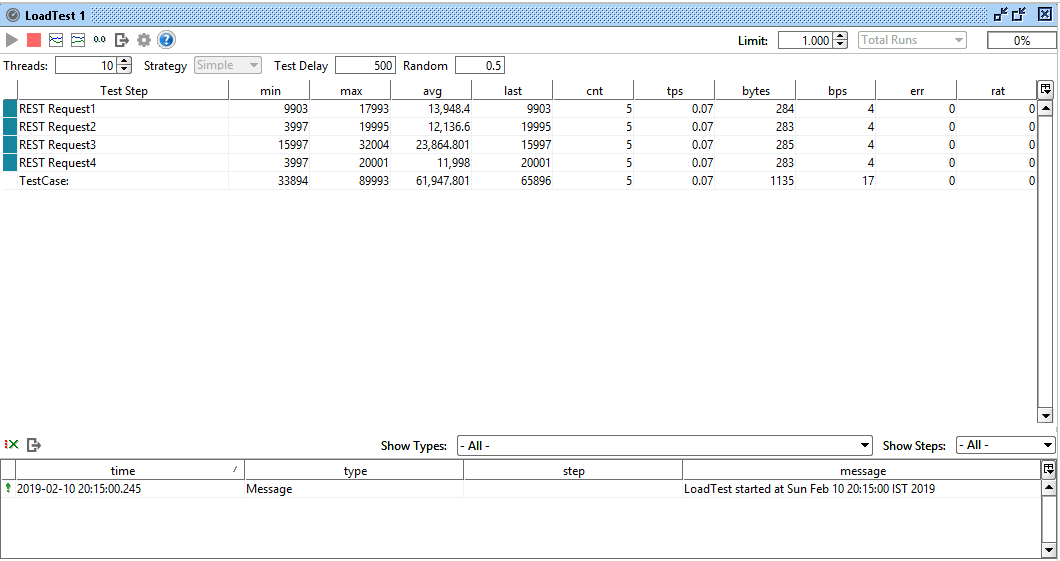
We run the demo application, & hit the load test using SOAP UI tool. In below screenshot, you can see the which operation is in progress & how many time it is taking.


Here is the statics of SOAP UI Load test. You can see the latency of the request min, max, and average.


So at this point, we are ready to take the thread dump. Our performance test is already running & in SOAP UI test we have already seen that our threads are getting saturated & latency is increasing for the REST calls. I will show how we can take thread dump on Windows & Linux operating systems. 

How to take a thread dump and analyze it 

1. For taking a thread dump of the java process, JDK has provided few commands in the bin directory. make sure you have updated the PATH variable to include java bin directory. otherwise you are in the bin directory of JDK.


2. For taking thread dump, you should know for which java process you want to take a thread dump. JDK has provided "jps" command to list the java process. below is the sample execution of the command. am executing command -v option which will give me more verbose details about the process. and anyone can distinguish between the different Java process running simultaneously under one JVM. If you are on Linux you can use ps -ef | grep "java" to list all java process. in below screenshot, you can see sample java application is running with process id PID 31684.


3. Now we have found the java process for which we have to take the thread dump. You can use "jstack" command with process id and redirect the output to the file. if you are the linux user you can use kill -3 <<PID>> command to send the signal to java process which will dump the thread dump on stdout.


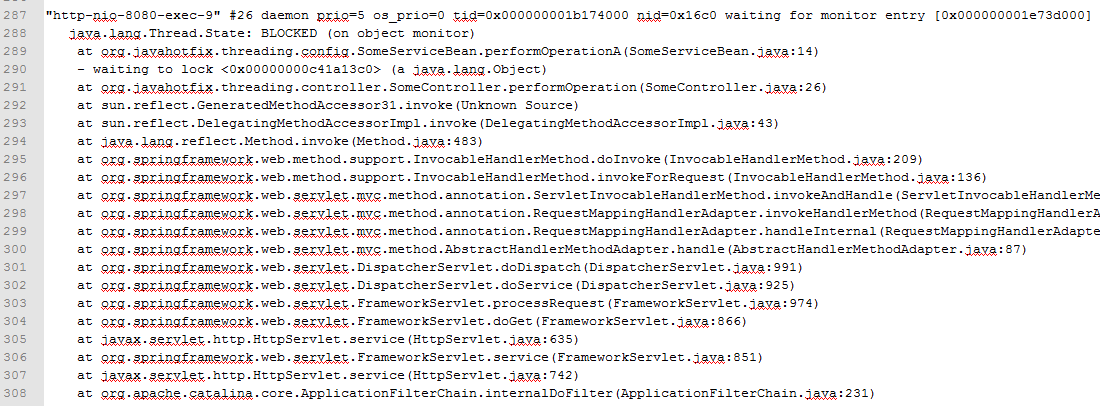
4. Now you have a thread dump file. a Thread dump file is a simple text file in which state of each thread is dumped with its call stack. there is various information associated with it like thread name, is it a demon thread, thread priority in JVM, thread priority in os, os transaction id, thread state, monitor. below is the screenshot of the thread dump file.


5. Now you have a thread dump file. there are many free tools which can analyze your thread dump and tell you what's wrong with your application. you can google for thread dump analyzer you will get a bunch of results which can analyze your thread dump. One of my favorites is fastthread.io. This website will give you the graphical representation of your thread dump. Let's analyze the result.


6. Open up the website and upload your dump file there. hit the analyze button. You can upload multiple thread dump file here.


7. Once processing is complete. you will see the report in the format of graphs and text. below is the sample report. Here in the below report, it is mention that analyzer has found the problem. 


Below 9 threads were blocked. you will get a nice description of the problematic scenario


Above image indicate that thread-8 has obtained a lock and did not release and due to this other threads are waiting. you can click on each thread to check in the call stack at what point they are blocked.


In this way, we can analyze the thread dump and can get rid of the problematic coding path.

Sunday, February 3, 2019

Analyzing Memory Leak, Heap Dump of java application using Eclipse Memory Analyzer Plugin and Visual VM


Hello Friends in this tutorial we will be learning how to analyze if your Java application has a memory leak. if your java application is crashing or not responding and you are getting an intermittent error of java.lang.OutOfMemory then you must refer to this tutorial.

Outline of this Tutorial
  • Quick Information About memory leak 
  • Start with checkout GitHub code which has a memory leak
  • Configure JMX Monitoring & Setting Maximum Heapsize
  • Hitting few calls till we get the OOM Response
  • Capture & Inspect Heap Dump to Check whats Wrong in the code flow

Let's Understand what is a memory leak 
First of all, let's understand what is a memory leak in an application. All application uses the memory to store its object. Let say I have an Inventory Management System, then before updating the data to the database, the application needs to input it from user & save on the memory & further code flow will take the value and update it to the database. suppose in this flow the object am saving on memory does not get clean and will exist there for a long running time. although this object is not useful still it is consuming my memory. such leaking of an object may not take much memory in a day but over a month will consume a lot of space in memory. in such a scenario, the application will face the problem if it is reached to maximum memory capacity. for storing new object or performing its routine task it will not get empty space & it started crashing. Such scenario java application throws OutOfMemory error.

JVM has an internal routine to clean up the unused objects from heap/memory, but if the leaking object is tied to a live reference then java will not clean those object for you. it will store those object and once you get out of the maximum memory capacity you will get java.lang.OutOfMemoryError.


What our demo Application will do
We have developed a demo application by which we will reproduce the OutOfMemory scenario. checkout GitHub application from here. In this application, we will be uploading the image file from the user from XYZ processing. During we are storing the image in ArrayList and we forgot to remove the image from ArrayList once our processing is complete. This ArrayList will be stored in one singleton object.


Configure JMX Monitoring & Maximum heap size for our java application
Here we have configured parameter to our java application which will help us to monitor our java application. You can read more for JMX at below link

https://docs.oracle.com/javase/6/docs/technotes/guides/management/agent.html

Below is the build.gradle file for the demo application.

bootRun {
 jvmArgs = [
  
 // configure heap size minimum 64mb and maximum 256mb
 "-Xms64m",
 "-Xmx256m",
 
 // enable remote debugging
     "-Xdebug",
     "-Xrunjdwp:transport=dt_socket,server=y,address=8001,suspend=n",
     
     // enable JMX remote monitoring
     // https://docs.oracle.com/javase/6/docs/technotes/guides/management/agent.html 
     "-Dcom.sun.management.jmxremote",
  "-Dcom.sun.management.jmxremote.port=9010",
  "-Dcom.sun.management.jmxremote.local.only=false",
  "-Dcom.sun.management.jmxremote.authenticate=false",
  "-Dcom.sun.management.jmxremote.ssl=false"
    ]
}

Here we started JMX service on "port" 9010. we have put "local.only" setting to false which means we can connect our monitoring tool to this application from a remote host as well. "authentication" is false, will be good for the development environment. we have added some JVM argument about the heap size, we have set minimum heap size to 64 MB and maximum size to 256 MB. This will help us to reproduce this issue quickly.


Sending Request to Application
We will be using CURL to send the request to our application. You can use Postman, ARC tools to send the request. You can also use JMeter, Dynatrace tools to run the load test. I have uploaded the 8MB File much time through post request which will help me to get the scenario to reproduce very easily.

executing curl command for upload file


Once you reach to this step, you will see you are getting many OutOfMemoryError in logs. I have attached below screenshot for the logs.


Let's start our monitoring tool to do analysis what's wrong with the application
In the market, there are various tools to monitor the java application using JMX service. One application provided out of the box when you install the Java Development Kit. It is known as "jvisualvm". If you open the installation/bin directory of your JDK you will see jvisualvm.exe executable file. Just launch it & GUI will come in front of you. In the below image you can see highlighted executable file.


Once you launch the visualvm, you need to select the host which you wants to monitor. By default, all local running java application will be visible in the local window. refer below screenshot.

From Remote section, you can add a remote host, by providing the hostname & JMX port and authentication if any. our demo application is running on localhost machine it is shown therein Local section & it is highlighted. In Below Screenshot we have connected to our local application. Below are the step you can perform to do memory analysis using jvisualvm.


  • Connect to the application using jvisualvm. the application can be local or remote.
  • Click on Heap Dump & Open Heap dump window.

  • Switch to Classes Tab from Summary Tab
  • Sort the List by size column. This may ask to calculate the retained value, allow them.
  • Select the Item which is consuming Maximum of memory size and right click on it and select "Show in Instance View"

  • From Instance View Sort again instance by size. Choose the first element, Expand the tree present in Reference tab. From here you can get the idea how this element get stored in memory and not cleaned.

  • In the above screenshot, you can see on the reference tab, SomeSingletonInstance class is storing all the reference to these items. in this way you can check the remaining instance as well, which are consuming memory.


Using Eclipse Memory Analyzer Plugin to analysis

Using jvisualvm might be not so helpful if your objects are small in size. visualvm will not collect the similar type of object and provide you graphical representation. Eclipse head dumps analyzer plugin will scan your heap dump and provide you the graphical representation of your memory & source from where this data is created. follow below steps to do analysis using eclipse memory analyzer.


  • You need to install "Eclipse Memory Analyser" software from Eclipse Marketplace. To do so click on help -> Eclipse Marketplace and search for "Eclipse Memory Analyser"

  • Once You Install the Software inside your Eclipse it will ask for a restart to adopt the changes.
  • Click on New -> "Others" and in dialogue box under "Other" click on "Heap Dump"

  • If your process is local then this dialogue box will list all the running java process. Once you select the process, this tool will capture heap dump for you.

  • If your process is remote, you can take "Heap Dump" of the remote process using jvisualvm, jmap command. Open this Heap Dump file in Eclipse. 
  • Once the Heap Dump Project open, You will see the Graphical Representation of the Objects.

  • Click on "Dominator Tree". Sort the List by Percentage Descending Order.
  • Expand the Tree which is having the highest usage percentage. As you go to the root of this tree you will come to know from which class this memory leak is happing. You can correct the flow there. 


  • So above Highlighted Items are consuming memory and not releasing them although they are done with there task.


Summary & things to be taken care to avoid memory leak

  • The memory leak will happen if you are storing objects on the heap and not releasing them. if you don't need then clean them.
  • Possible cause of memory leak is poor design using Static classes & Singleton instances. Don't use collection classes in static scope or collection classes in singleton instance. If you do so Ensure that you are properly releasing the object. Have a 4 to 5-hour performance test and analyze the heap dump on each interval of 1 hour.
  • For taking heap dump we can use the jmap command. this will be there in the installation/bin directory of your JDK.
  • There are GUI Based tools also which will help you to take a heap dump. jvisualvm will be available in the JDK installation directory. You will also get many eclipse plugins to do so.
  • While Analysing Heap Dump calculates retained size & sort the instance based on size, group them in classes & go to the root of the objects whose size are big enough.
  • While going to root you will get an idea about the flows & classes by which this object was stored.

Ok, that's all for this tutorial friends. you have any question, suggestion please comment below. 
Happy Coding :)