Showing posts with label thread dump. Show all posts

Saturday, March 2, 2019

How to take java thread dump on windows, Linux & Other Operating System


Hello Friends, Today in this blog we will be learning how to take a thread dump on Windows and Linux Operating System. We can take a Thread dump of a local running process or remotely running process. If you already have a thread dump and just looking for the information to analyze then you can refer my blog here

Let's get started then.


Capturing Thread dump of Local Running Process on Linux Operating System
We will be using kill command here, This is the most popular command in Linux to send a different kind of signals to the process. this command is only available on Linux and not on windows. We have to send the SIGQUIT signal and the process id with this command. To learn different Linux kill command signals check out here. refer below steps.

1. Identify the process id of the java application for which we want to take a thread dump. You can use the ps command to list all process & grep the java keyword.
Command: $ ps -ef | grep "java"
Example:

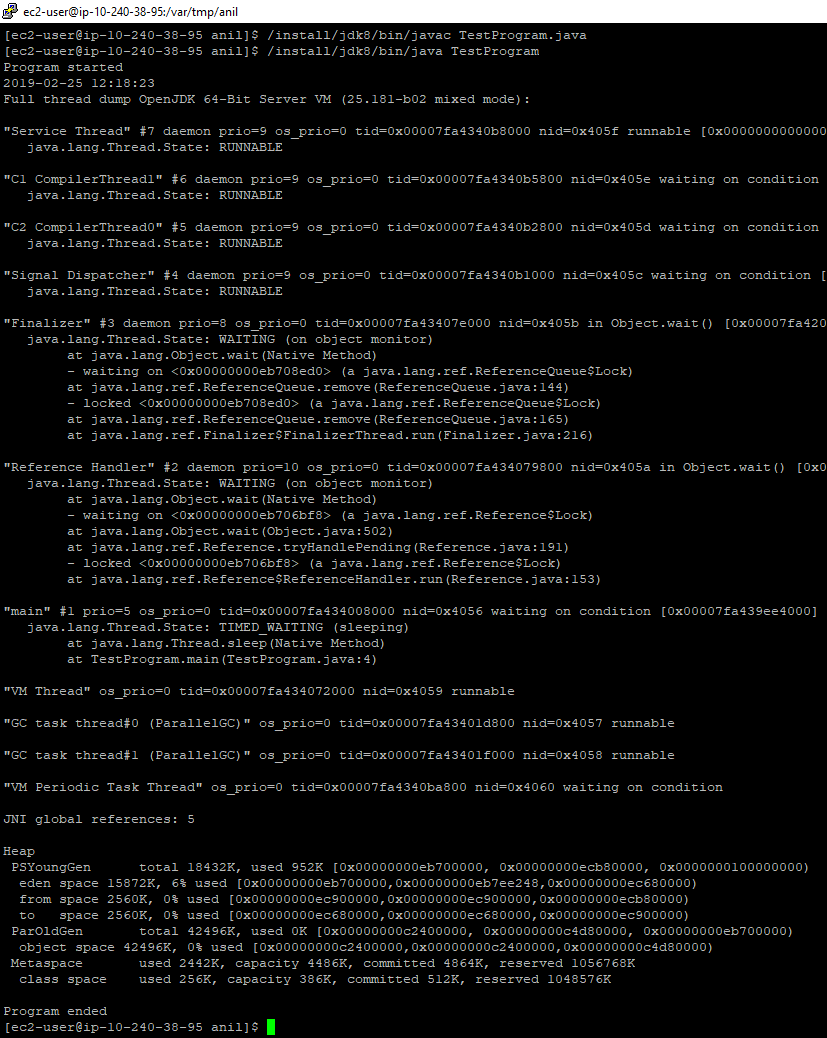
2. use the "Kill -3" command followed by process id which will take a thread dump of the process and put it to STDOUT of the application. Here -3 is equivalent to send SIGQUIT signal to the process.
Command: $ kill -3 <PID>
Example:


Capturing Thread dump of Local Running Process on Windows or Other Operating System
We will be using jstack & jps command here. this command ships with your JDK installation bundle and present in the bin directory of the JDK. You can use this command on Linux as well as Windows & Other Operating system. before running these commands ensure JDK bin directory is added to the PATH environment variable. below are the steps

1. Identify the java process id for which you want to take a thread dump. for this, you can use jps command. Executing this command will list the all running java application. You need process id from the output list.


2. Now we know the process id, use the jstack command to print the thread dump on the console.


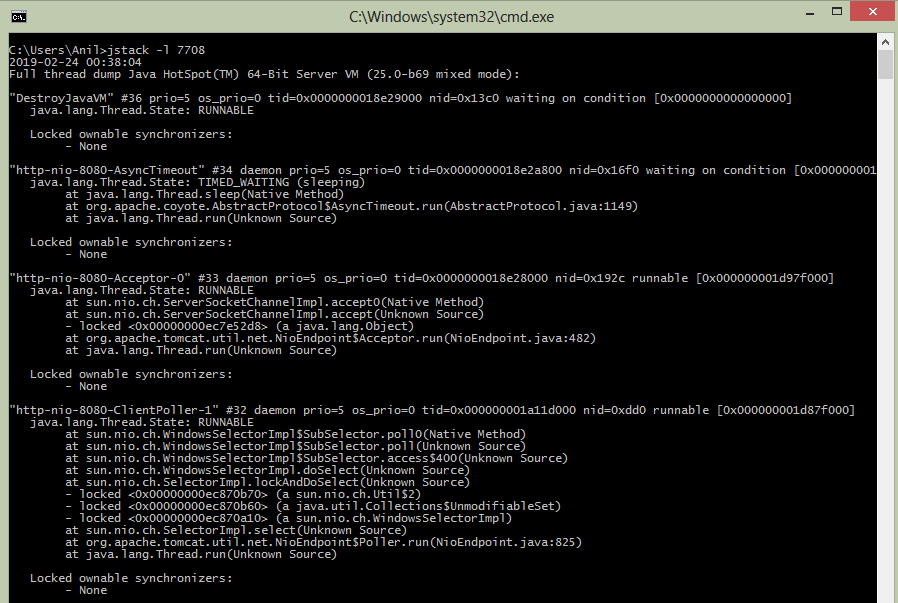
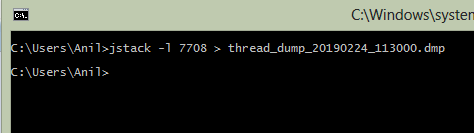
3. You can redirect output to separate text file which will be easy to maintain & process by thread dump analyzer tools.


Capturing a thread dump of remotely running java process
In this technique, we don't have to ssh or log in to the remote system. We have to enable the JMX Monitoring on our java application before running. When we enable this functionality, java application opens a port over which many things can be carried out. like statics of the application, thread dump, heap dump. You can read more about this here


Using GUI Tools for Thread dump and other monitoring tasks
JDK provides 2 GUI tools for application monitoring. both ship with JDK bundle & present in the bin directory of the JDK. "JConsole" is one tool from you can see the live thread stack trace. you can use this tool on Linux as well as on Windows for the locally running or remotely running java process. Below are the few features provided by this tool
  • View Memory Status
  • View MBeans
  • View Stack trace of a thread
  • VM Status

For remotely running process you need to enable JMX Port on the process.


 JConsole Tool

There is another tool called "JVisualVM", this tool will give you more insights than "JConsole". Few features of this tool are listed below.

  • Take Thread Dump
  • Take Heap Dump
  • Check Heap memory status
  • View stack trace of a thread
  • Ask JVM to invoke GC
  • Check CPU Usage
  • Analyze Heap dump
  • Sampler 
  • Profiling 


That's all for this tutorial friends. Please let me know your comments, questions or suggestion in below comment box, I will definitely try to improve the content and resolve your queries.

Thursday, February 21, 2019

Find out latency increase issue while performance test, take java thread dump and analyze it


Hello Friends in this blog we will be learning how to analyze thread saturation. if your application facing latency issue on load/performance test you should read this article.   

Background of the Problem Statement 
In a large complex java application, it happens many times that few operations run well when running in isolation. But the Latency of the calls increases during performance/load test. This might be happening due to the poor design of the multithreaded system. Below are the few signs which might cause slowness/increase latency to your application calls & this may vary depending on the system. am listing out the generic problem which everyone might encounter.
  • Excessive use of synchronization with improper lock objects
  • Connect to an external system, where the external system does not guarantee immediate response
  • Executing expensive SQL Queries / Using non-indexed columns on the OLTP system
  • Configuring the low number of thread pool & request incoming rate is too high, we can say as thread tuning is not well


How Multithreaded system works
Before we understand the problem in depth, let us understand how multi-threaded system work. Let us take an example of apache tomcat web server. each application server has a thread pool. it has a finite number of threads are defined like 50 or 80 or 100. whenever a request comes into the system, a corresponding job is added to the queue. job scheduler/thread manager check for free thread & assign the job to the thread for execution. and in this way, the job gets on to his journey of serving your request. Here below image depict the picture of what we discussed just now

Ultimately now the job for fetching employee details of id 1234, will assign to thread "Thread #1" as it is an ideal state & ready to work. remaining threads are currently working on another task. so they cannot take other tasks they get freed.

Let's get back to our problem statement
So now you have understood, how the multithreaded system works, you can imagine what can happen if all threads are currently working/running state & constantly new jobs are coming into the system. what will happen in this case? All new job will be queued up. as in when thread frees from their existing task, it will pick up a job from the waiting queue. this will impact the execution time of the request. so now the caller will have to wait till the job was in queue + actual job execution time. in this way, latency gets increased. So now we have understood that queuing up jobs will cause latency increase. Thread execution time should be finitely based on what type of system you are designing & what level of TPS you want to archive from your system. let us see some scenario that one should avoid, which cause the long-running operation execution on the thread. 

So now you have aware of what to do and what not. But how will you identify the problem the in the large complex application if you face increasing latency, slowness problem under load or performance test? 

Just to simulate the latency, I have developed the sample spring boot application which we will be used to identify the problem. I have developed this application just to simulate the thread saturation. It is having "thread.sleep()" statement to simulate latency by external calls or heavy database query.


We run the demo application, & hit the load test using SOAP UI tool. In below screenshot, you can see the which operation is in progress & how many time it is taking.


Here is the statics of SOAP UI Load test. You can see the latency of the request min, max, and average.


So at this point, we are ready to take the thread dump. Our performance test is already running & in SOAP UI test we have already seen that our threads are getting saturated & latency is increasing for the REST calls. I will show how we can take thread dump on Windows & Linux operating systems. 

How to take a thread dump and analyze it 

1. For taking a thread dump of the java process, JDK has provided few commands in the bin directory. make sure you have updated the PATH variable to include java bin directory. otherwise you are in the bin directory of JDK.


2. For taking thread dump, you should know for which java process you want to take a thread dump. JDK has provided "jps" command to list the java process. below is the sample execution of the command. am executing command -v option which will give me more verbose details about the process. and anyone can distinguish between the different Java process running simultaneously under one JVM. If you are on Linux you can use ps -ef | grep "java" to list all java process. in below screenshot, you can see sample java application is running with process id PID 31684.


3. Now we have found the java process for which we have to take the thread dump. You can use "jstack" command with process id and redirect the output to the file. if you are the linux user you can use kill -3 <<PID>> command to send the signal to java process which will dump the thread dump on stdout.


4. Now you have a thread dump file. a Thread dump file is a simple text file in which state of each thread is dumped with its call stack. there is various information associated with it like thread name, is it a demon thread, thread priority in JVM, thread priority in os, os transaction id, thread state, monitor. below is the screenshot of the thread dump file.


5. Now you have a thread dump file. there are many free tools which can analyze your thread dump and tell you what's wrong with your application. you can google for thread dump analyzer you will get a bunch of results which can analyze your thread dump. One of my favorites is fastthread.io. This website will give you the graphical representation of your thread dump. Let's analyze the result.


6. Open up the website and upload your dump file there. hit the analyze button. You can upload multiple thread dump file here.


7. Once processing is complete. you will see the report in the format of graphs and text. below is the sample report. Here in the below report, it is mention that analyzer has found the problem. 


Below 9 threads were blocked. you will get a nice description of the problematic scenario


Above image indicate that thread-8 has obtained a lock and did not release and due to this other threads are waiting. you can click on each thread to check in the call stack at what point they are blocked.


In this way, we can analyze the thread dump and can get rid of the problematic coding path.