Hello Friends in this tutorial we will be learning how to analyze if your Java application has a memory leak. if your java application is crashing or not responding and you are getting an intermittent error of java.lang.OutOfMemory then you must refer to this tutorial.
Outline of this Tutorial
- Quick Information About memory leak
- Start with checkout GitHub code which has a memory leak
- Configure JMX Monitoring & Setting Maximum Heapsize
- Hitting few calls till we get the OOM Response
- Capture & Inspect Heap Dump to Check whats Wrong in the code flow
Let's Understand what is a memory leak
First of all, let's understand what is a memory leak in an application. All application uses the memory to store its object. Let say I have an Inventory Management System, then before updating the data to the database, the application needs to input it from user & save on the memory & further code flow will take the value and update it to the database. suppose in this flow the object am saving on memory does not get clean and will exist there for a long running time. although this object is not useful still it is consuming my memory. such leaking of an object may not take much memory in a day but over a month will consume a lot of space in memory. in such a scenario, the application will face the problem if it is reached to maximum memory capacity. for storing new object or performing its routine task it will not get empty space & it started crashing. Such scenario java application throws OutOfMemory error.
JVM has an internal routine to clean up the unused objects from heap/memory, but if the leaking object is tied to a live reference then java will not clean those object for you. it will store those object and once you get out of the maximum memory capacity you will get java.lang.OutOfMemoryError.
What our demo Application will do
We have developed a demo application by which we will reproduce the OutOfMemory scenario.
checkout GitHub application from here. In this application, we will be uploading the image file from the user from XYZ processing. During we are storing the image in ArrayList and we forgot to remove the image from ArrayList once our processing is complete. This ArrayList will be stored in one singleton object.
Configure JMX Monitoring & Maximum heap size for our java application
Here we have configured parameter to our java application which will help us to monitor our java application. You can read more for JMX at below link
https://docs.oracle.com/javase/6/docs/technotes/guides/management/agent.html
Below is the build.gradle file for the demo application.
bootRun {
 jvmArgs = [

 // configure heap size minimum 64mb and maximum 256mb
 "-Xms64m",
 "-Xmx256m",

 // enable remote debugging
     "-Xdebug",
     "-Xrunjdwp:transport=dt_socket,server=y,address=8001,suspend=n",

     // enable JMX remote monitoring
     // https://docs.oracle.com/javase/6/docs/technotes/guides/management/agent.html
     "-Dcom.sun.management.jmxremote",
  "-Dcom.sun.management.jmxremote.port=9010",
  "-Dcom.sun.management.jmxremote.local.only=false",
  "-Dcom.sun.management.jmxremote.authenticate=false",
  "-Dcom.sun.management.jmxremote.ssl=false"
    ]
}
Here we started JMX service on "
port" 9010. we have put "
local.only" setting to false which means we can connect our monitoring tool to this application from a remote host as well. "
authentication" is false, will be good for the development environment. we have added some JVM argument about the heap size, we have set minimum heap size to 64 MB and maximum size to 256 MB. This will help us to reproduce this issue quickly.
Sending Request to Application
We will be using CURL to send the request to our application. You can use Postman, ARC tools to send the request. You can also use JMeter, Dynatrace tools to run the load test. I have uploaded the 8MB File much time through post request which will help me to get the scenario to reproduce very easily.
Once you reach to this step, you will see you are getting many OutOfMemoryError in logs. I have attached below screenshot for the logs.
Let's start our monitoring tool to do analysis what's wrong with the application
In the market, there are various tools to monitor the java application using JMX service. One application provided out of the box when you install the Java Development Kit. It is known as "
jvisualvm". If you open the installation/bin directory of your JDK you will see
jvisualvm.exe executable file. Just launch it & GUI will come in front of you. In the below image you can see highlighted executable file.
Once you launch the visualvm, you need to select the host which you wants to monitor. By default, all local running java application will be visible in the local window. refer below screenshot.
From Remote section, you can add a remote host, by providing the hostname & JMX port and authentication if any. our demo application is running on localhost machine it is shown therein Local section & it is highlighted. In Below Screenshot we have connected to our local application. Below are the step you can perform to do memory analysis using jvisualvm.
- Connect to the application using jvisualvm. the application can be local or remote.
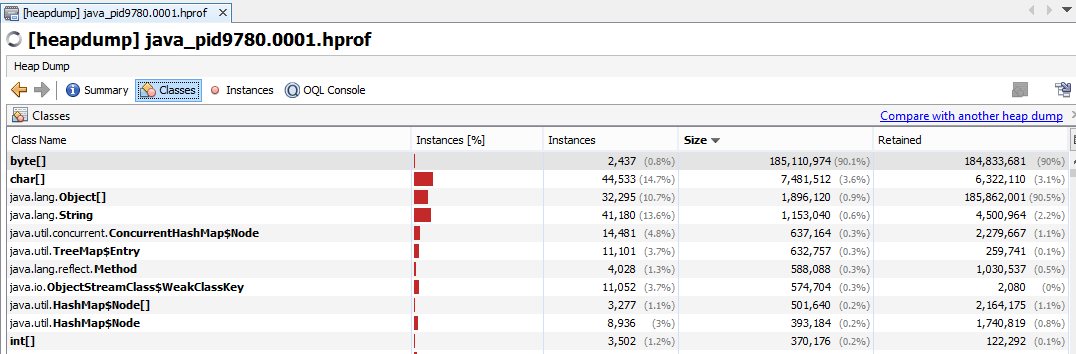
- Click on Heap Dump & Open Heap dump window.
- Switch to Classes Tab from Summary Tab
- Sort the List by size column. This may ask to calculate the retained value, allow them.
- Select the Item which is consuming Maximum of memory size and right click on it and select "Show in Instance View"
- From Instance View Sort again instance by size. Choose the first element, Expand the tree present in Reference tab. From here you can get the idea how this element get stored in memory and not cleaned.
- In the above screenshot, you can see on the reference tab, SomeSingletonInstance class is storing all the reference to these items. in this way you can check the remaining instance as well, which are consuming memory.
Using Eclipse Memory Analyzer Plugin to analysis
Using jvisualvm might be not so helpful if your objects are small in size. visualvm will not collect the similar type of object and provide you graphical representation. Eclipse head dumps analyzer plugin will scan your heap dump and provide you the graphical representation of your memory & source from where this data is created. follow below steps to do analysis using eclipse memory analyzer.
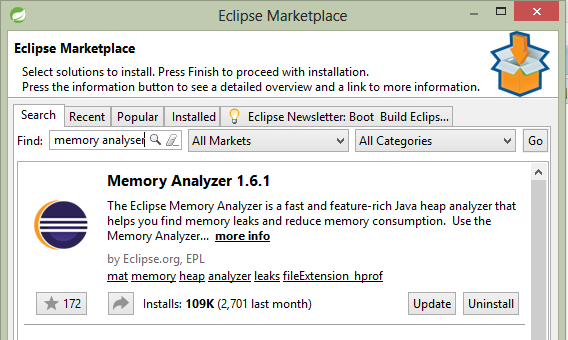
- You need to install "Eclipse Memory Analyser" software from Eclipse Marketplace. To do so click on help -> Eclipse Marketplace and search for "Eclipse Memory Analyser"
- Once You Install the Software inside your Eclipse it will ask for a restart to adopt the changes.
- Click on New -> "Others" and in dialogue box under "Other" click on "Heap Dump"
- If your process is local then this dialogue box will list all the running java process. Once you select the process, this tool will capture heap dump for you.
- If your process is remote, you can take "Heap Dump" of the remote process using jvisualvm, jmap command. Open this Heap Dump file in Eclipse.
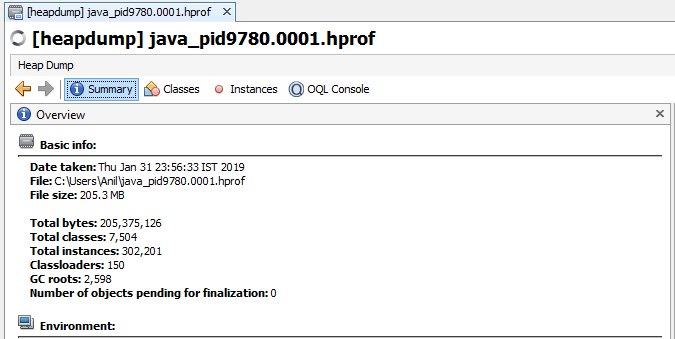
- Once the Heap Dump Project open, You will see the Graphical Representation of the Objects.
- Click on "Dominator Tree". Sort the List by Percentage Descending Order.
- Expand the Tree which is having the highest usage percentage. As you go to the root of this tree you will come to know from which class this memory leak is happing. You can correct the flow there.
- So above Highlighted Items are consuming memory and not releasing them although they are done with there task.
Summary & things to be taken care to avoid memory leak
- The memory leak will happen if you are storing objects on the heap and not releasing them. if you don't need then clean them.
- Possible cause of memory leak is poor design using Static classes & Singleton instances. Don't use collection classes in static scope or collection classes in singleton instance. If you do so Ensure that you are properly releasing the object. Have a 4 to 5-hour performance test and analyze the heap dump on each interval of 1 hour.
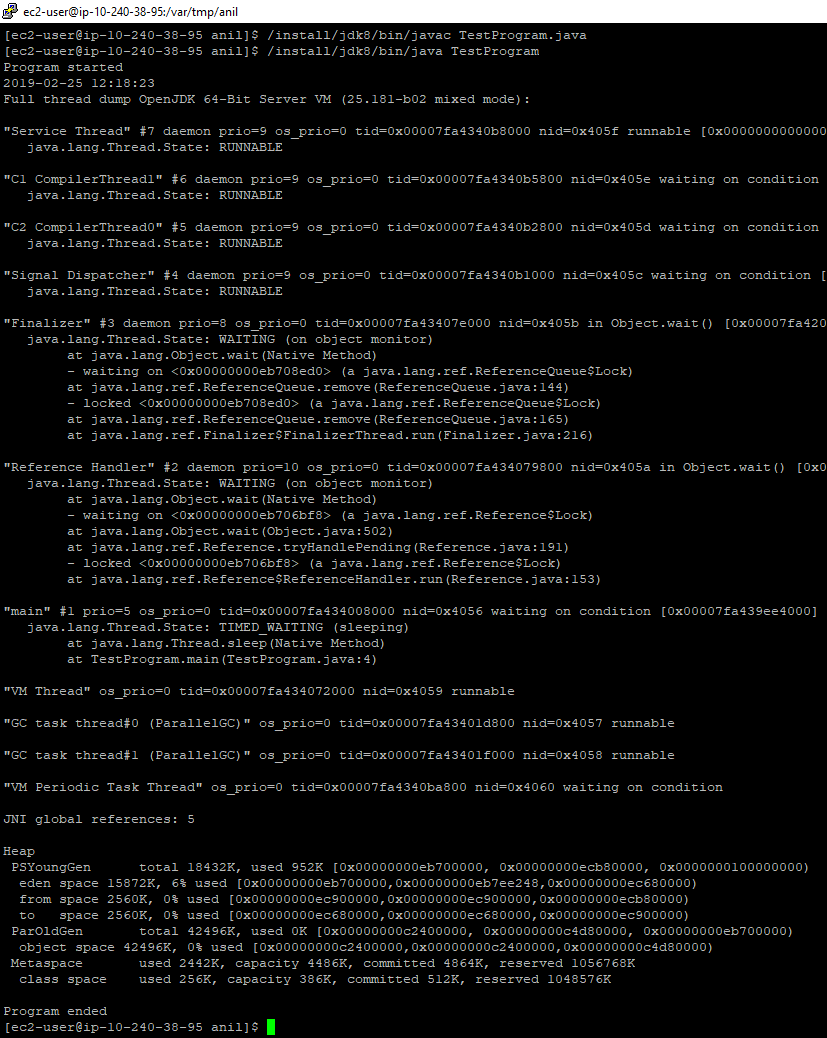
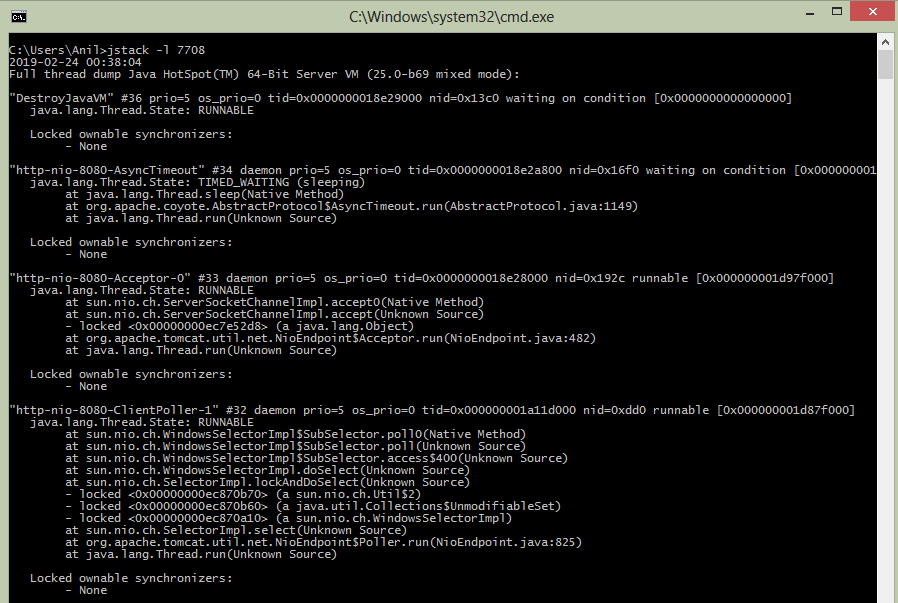
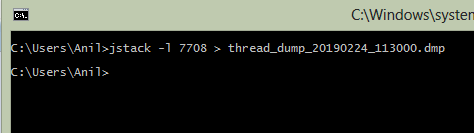
- For taking heap dump we can use the jmap command. this will be there in the installation/bin directory of your JDK.
- There are GUI Based tools also which will help you to take a heap dump. jvisualvm will be available in the JDK installation directory. You will also get many eclipse plugins to do so.
- While Analysing Heap Dump calculates retained size & sort the instance based on size, group them in classes & go to the root of the objects whose size are big enough.
- While going to root you will get an idea about the flows & classes by which this object was stored.
Ok, that's all for this tutorial friends. you have any question, suggestion please comment below.
Happy Coding :)